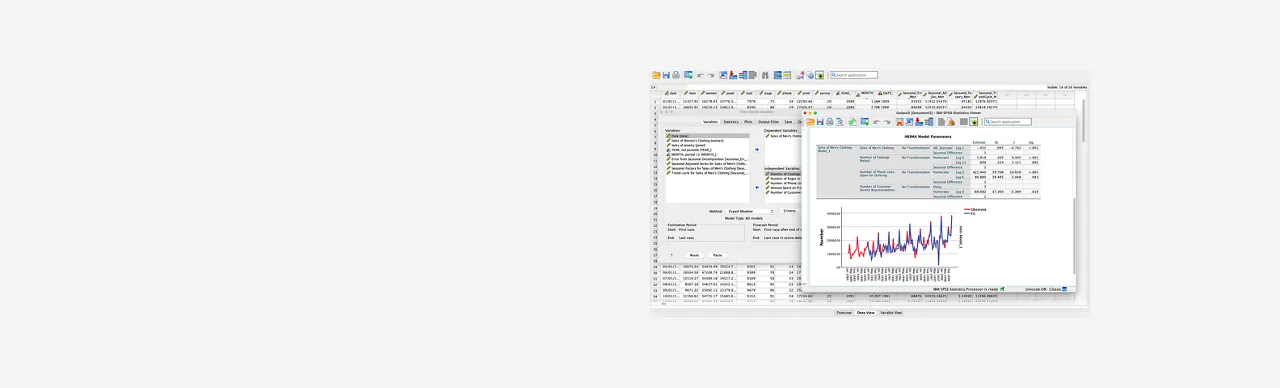
IBM SPSS Forecasting vs K Score
AI-enhanced independent comparison — features, pros, cons, pricing and rankings.
Who each tool serves best — and when to pick the other one.
Data analysts and business teams requiring reliable, automated time series forecasting for demand, supply, or risk management.
- You need to forecast demand or supply using historical time series data accurately.
- You want automated model selection to simplify complex forecasting workflows.
- Your team requires integration with IBM analytics platforms for end-to-end insights.
Users seeking modern UI/UX, transparent pricing, or lightweight forecasting tools for ad hoc analysis.
- You need a free, fully transparent pricing model for small-scale use.
- Free-tier limits are a blocker for experimenting with forecasting models.
- You require a modern, intuitive user interface for quick ad hoc forecasts.
Automated, statistically rigorous time series forecasting with integration into IBM analytics.
Individual investors and traders who want AI-based quantitative stock scores to enhance market analysis.
- You want to incorporate quantitative AI scores into your stock analysis workflow.
- You need a tool that synthesizes multiple financial data sources into one actionable score.
- Your investment strategy benefits from predictive analytics on stock trends.
Casual investors who prefer simple tools or users needing extensive API access and integrations.
- You need a fully integrated trading platform with order execution capabilities.
- Free-tier limits are a blocker for your data analysis needs beyond basic scoring.
- You require extensive API access or third-party integrations for automation.
The accuracy and reliability of its AI-driven stock scoring system.
A canonical comparison across capabilities common to this category. Vendor-specific extras appear below in "Highlighted Features".
| Capability | IBM SPSS Forecasting | K Score |
|---|---|---|
|
Free Tier Available
Usable without payment (with usage limits)
|
✓ | ✓ |
Each tool's marketing-listed features. Where a feature appears under one tool but not the other, it usually reflects how the vendor describes their product — not a definitive capability gap.
- Automated Model Selection — Automatically selects best forecasting model based on data
- Multiple Forecasting Algorithms — Supports ARIMA, Exponential Smoothing, and more
- Scenario analysis — Enables what-if forecasting scenarios
- Integration with IBM SPSS Statistics — Seamless data exchange with IBM analytics tools
- Customizable Forecasting Models — Allows manual tuning of forecasting parameters
- Quantitative Stock Scoring — Generates predictive scores based on financial data
- Multi-Source Data Integration — Combines various financial and market data sources
- Trend Forecasting — Predicts potential stock price movements
- Alerts and notifications — Custom alerts on stock score changes
- Historical data analysis — Access to past stock score trends
- Automated and customizable forecasting models
- Strong statistical and analytical foundation
- Integration with IBM SPSS Statistics
- Supports multiple forecasting scenarios
- Reliable for enterprise-grade forecasting
- Integrates diverse financial data for comprehensive scoring
- Clear, actionable stock trend predictions
- Suitable for quantitative investors
- Accessible free tier for basic use
- Focused on investment decision support
- Pricing is not transparent and requires contact
- User interface is outdated compared to modern tools
- No public API for automation
- Limited mobile or desktop app availability
- Pricing details for paid plans are not fully transparent
- Demand forecasting for retail and manufacturing
- Supply chain risk analytics
- Agricultural yield prediction
- Financial time series forecasting
- Inventory optimization
- Stock trend prediction for active traders
- Quantitative investment research
- Portfolio risk assessment
- Market opportunity identification
- Supplemental data for financial advisors
No third-party integrations confirmed.
Natural languages each tool generates and understands. Primary languages are listed first.
What each tool can accept (input) and produce (output) — text, image, audio, video, code.
Offers a freemium model with limited features; full capabilities require paid licenses with pricing available upon request.
-
Free
Free
Offers a free plan with basic features and paid subscriptions for advanced data and analytics.
-
Free
Free -
Pro
popular
Custom pricing
Regulatory frameworks each tool claims compliance with (HIPAA, SOC 2, GDPR, etc.).
None listed.
Third-party audits and certifications that verify security controls.
No certifications listed.
Vendor-published numbers each tool highlights — usage scale, breadth, and operational stats. Different tools track different metrics, so direct row-by-row comparison usually isn't meaningful.
- Forecast Accuracy High
- Predictive Accuracy High
Who each tool is positioned for — primary audience first.
How you can reach support — email, live chat, phone, community, docs.
- Documentation primary visit ↗
- Documentation primary
How each tool is classified in the Volvenix catalog.
These vocabulary domains are managed in our catalog but not yet exposed at the tool level. We're tracking them for future expansion of this comparison.
- Encryption Types — AES-256, ChaCha20, RSA-2048, and similar at-rest/in-transit cipher families.
- Encryption Contexts — where encryption is applied (data at rest, in transit, end-to-end).
- Plan-tier Model Mapping — which AI models are available on which pricing tier (currently only the model list is tracked, not the per-plan availability).
- What is this tool?
- IBM SPSS Forecasting is a software for time series forecasting and predictive analytics.
- How much does it cost?
- It offers a freemium model with limited features; full pricing requires contacting IBM sales.
- Does it have a free plan?
- Yes, a free plan with basic forecasting features is available.
- What integrations does it support?
- It integrates primarily with IBM SPSS Statistics and IBM analytics platforms.
- Who is it best for?
- Best suited for analysts and businesses needing automated, reliable time series forecasting.
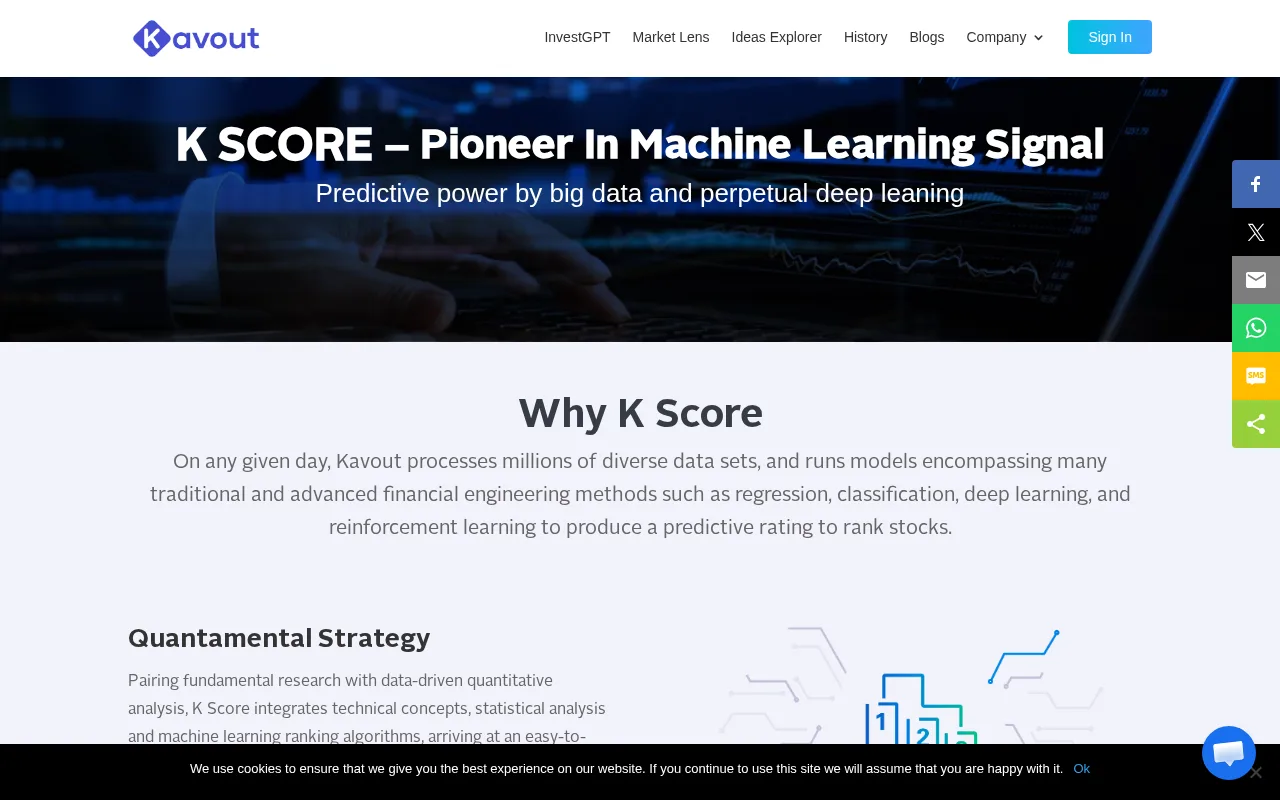
- What is this tool?
- K Score is a machine learning tool that analyzes financial data to generate predictive stock scores.
- How much does it cost?
- K Score offers a free plan with basic features and paid subscriptions for advanced analytics.
- Does it have a free plan?
- Yes, there is a free plan providing access to basic stock scores.
- What integrations does it support?
- K Score currently does not offer public API or third-party integrations.
- Who is it best for?
- It is best suited for investors and traders who use quantitative data to guide stock decisions.
| Info | IBM SPSS Forecasting | K Score |
|---|---|---|
| Pricing | Freemium | Freemium |
| Category | Agriculture & AgTech AI | Machine Learning Models & Algorithms |
| Deployment | Desktop | Cloud |
| Learning Curve | Intermediate | Intermediate |
| Free Plan | ✓ | ✓ |
| AI Agent | ✗ | ✗ |
| Autonomy | Assistant | Assistant |
| Risk Tier | Low | Low |
K Score has an overall score of 5.3/10 and offers a freemium pricing model, focusing primarily on providing a basic set of forecasting features suitable for small to medium-sized projects. IBM SPSS Forecasting, with a slightly higher overall score of 5.5/10 and also using a freemium pricing structure, provides more advanced statistical analysis and forecasting capabilities, often used in enterprise environments for complex data modeling and predictive analytics. While both tools offer freemium access, IBM SPSS Forecasting tends to support more sophisticated use cases with a broader range of features compared to K Score.
ⓘ How Volvenix scores work
Scores are computed by Volvenix — not supplied by the vendors, and not third-party benchmark results. Each 0–10 dimension (Overall, Features, Usability, Support, Pricing) is a directional estimate aggregated from catalog signals — editorial cataloguing, content depth, engagement, and provider-reputation indicators — so treat them as a starting point, not a lab result.
Confidence reflects how complete the underlying data is for both tools; lower confidence means fewer signals were available, not a worse tool. We never accept payment for rankings or scores. More about how Volvenix works →