Climate TRACE vs SeeTree
AI-enhanced independent comparison — features, pros, cons, pricing and rankings.
| Dimension | Climate TRACE | SeeTree |
|---|---|---|
| Accuracy & Reliability | ||
| Ease of Use | ||
| Features & Capability | ||
| Value for Money | ||
| Performance & Speed | ||
| Popularity & Adoption |
Who each tool serves best — and when to pick the other one.
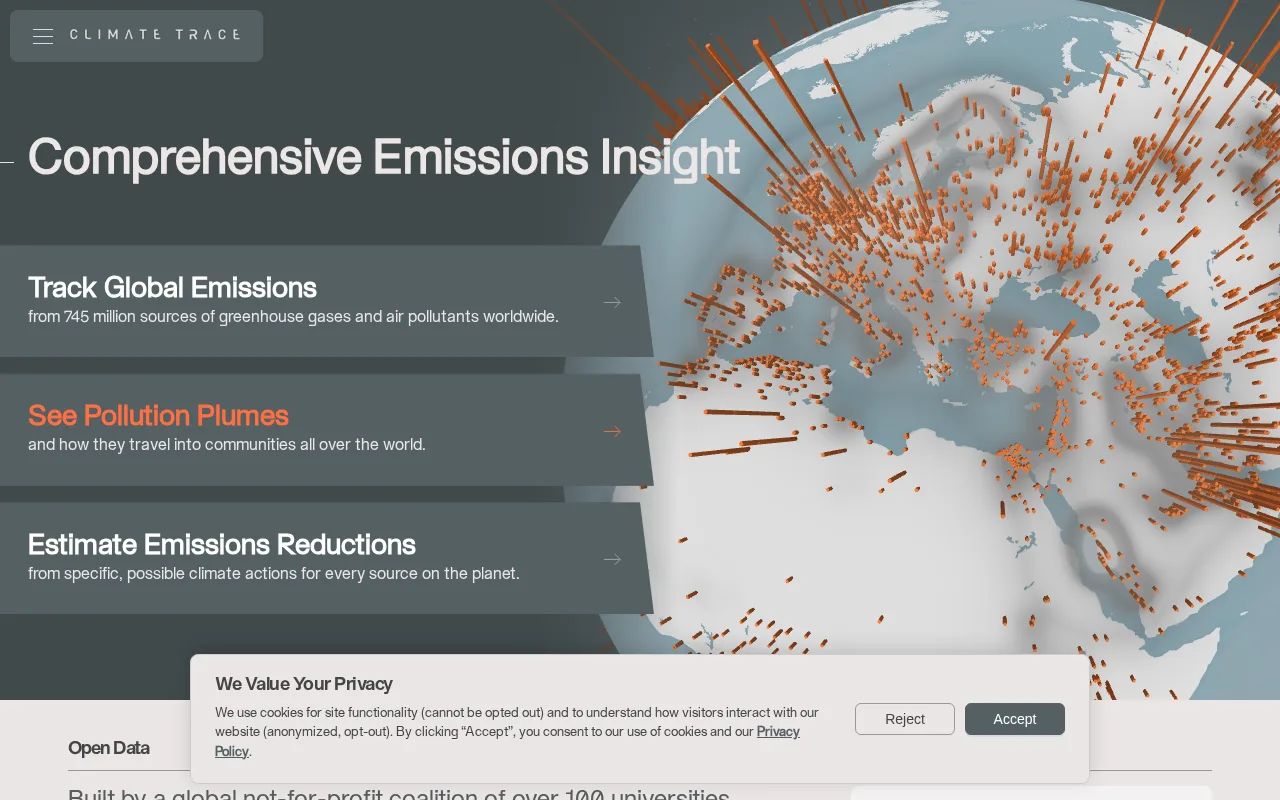
Researchers, policymakers, and NGOs requiring transparent, granular greenhouse gas emissions data worldwide.
- You need transparent, satellite-based greenhouse gas emissions data globally.
- You want free access to detailed emissions datasets for research or policy analysis.
- Your team requires granular facility-level emissions insights for climate impact assessment.
Users seeking comprehensive agricultural AI tools for crop monitoring or farm management should look elsewhere.
- You need AI tools focused on crop health monitoring or farm management.
- Free-tier limits are a blocker for your data access needs.
- You require integrated agricultural sensing or crop performance analytics.
The most important factor is the need for detailed, transparent emissions data at facility and sector levels.
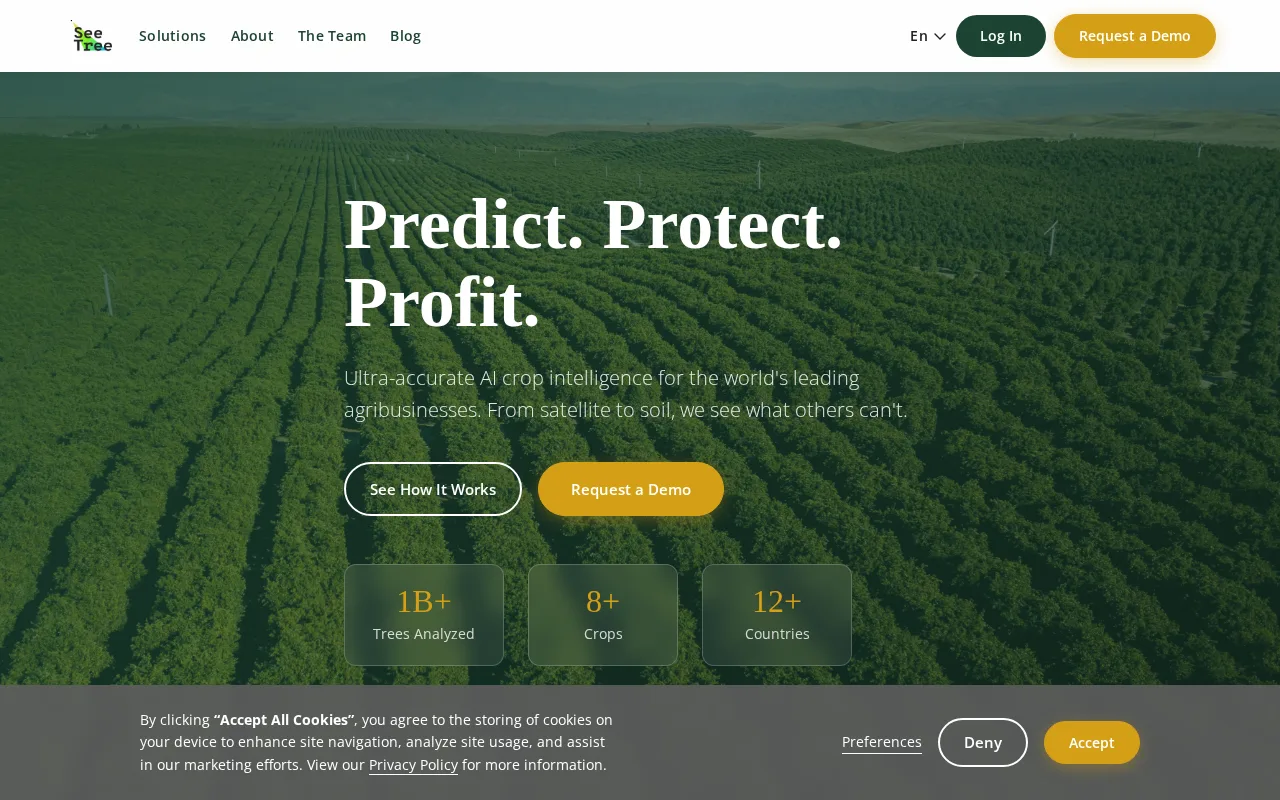
Commercial growers and orchard managers who require detailed, per-tree health data from drone imagery to optimize crop management.
- You need detailed, per-tree health analytics from aerial imagery for orchards or plantations.
- You want early detection of crop health issues to improve management and yield.
- Your team requires enterprise-grade crop monitoring tailored for perennial crops.
Small farms or growers without access to drone imaging or those needing free or low-cost solutions should avoid this tool.
- You need a free or low-cost crop monitoring solution for small-scale farms.
- Free-tier limits are a blocker for your budget or trial evaluation needs.
- You require extensive third-party integrations or public API access.
The ability to provide precise, per-tree health insights from drone imagery tailored for commercial perennial crop management.
A canonical comparison across capabilities common to this category. Vendor-specific extras appear below in "Highlighted Features".
| Capability | Climate TRACE | SeeTree |
|---|---|---|
|
Free Tier Available
Usable without payment (with usage limits)
|
✓ | — |
Each tool's marketing-listed features. Where a feature appears under one tool but not the other, it usually reflects how the vendor describes their product — not a definitive capability gap.
- Emissions Estimation — Estimates greenhouse gas emissions using satellite and sensor data
- Public Data Portal — Free access to emissions data and downloadable datasets
- Facility-Level Monitoring — Granular emissions data at facility and sector levels worldwide
- Sector-Level Analysis — Aggregated emissions data by industrial sectors
- Real-Time Updates — Regularly updated emissions estimates
- Per-tree Health Analytics — Detailed health metrics for individual trees
- Drone Imagery Processing — Analyzes aerial images for crop monitoring
- Early Issue Detection — Identifies potential health problems early
- Enterprise Dashboard — Centralized platform for data visualization
- Custom Reporting — Tailored reports for crop management
- Provides transparent, open emissions data
- Combines multiple data sources for accuracy
- Free public portal and downloadable datasets
- Supports global and facility-level monitoring
- Useful for climate policy and research
- Provides granular per-tree health data
- Enables early detection of crop health issues
- Specialized for commercial perennial crop growers
- Utilizes drone imagery for accurate monitoring
- Delivers actionable insights for crop management
- Limited to greenhouse gas emissions data
- No API or integration options publicly available
- Lacks crop health or agricultural monitoring features
- No publicly available pricing or free tier
- Lacks public API and third-party integrations
- Climate policy development and monitoring
- Environmental research and analysis
- NGO advocacy and transparency efforts
- Corporate emissions reporting
- Public awareness and education on emissions
- Orchard health monitoring
- Perennial crop vigor assessment
- Early detection of tree diseases
- Precision agriculture for tree crops
- Drone-based crop health surveys
Where each tool runs — web, mobile, desktop, browser extension, API.
No platforms confirmed.
Natural languages each tool generates and understands. Primary languages are listed first.
What each tool can accept (input) and produce (output) — text, image, audio, video, code.
Offers free public access to emissions data and datasets; advanced features or enterprise options not publicly detailed.
-
Free
Free
Pricing is enterprise-based and available upon request; no public pricing or free plans are offered.
-
Custom / Enterprise
Custom pricing
Regulatory frameworks each tool claims compliance with (HIPAA, SOC 2, GDPR, etc.).
None listed.
Vendor-published numbers each tool highlights — usage scale, breadth, and operational stats. Different tools track different metrics, so direct row-by-row comparison usually isn't meaningful.
- Global Coverage Facility-level emissions worldwide
- Data Accessibility Free public datasets and portal
No metrics published.
Who each tool is positioned for — primary audience first.
No specific audience listed.
How you can reach support — email, live chat, phone, community, docs.
- Email primary
- Email primary
How each tool is classified in the Volvenix catalog.
These vocabulary domains are managed in our catalog but not yet exposed at the tool level. We're tracking them for future expansion of this comparison.
- Encryption Types — AES-256, ChaCha20, RSA-2048, and similar at-rest/in-transit cipher families.
- Encryption Contexts — where encryption is applied (data at rest, in transit, end-to-end).
- Plan-tier Model Mapping — which AI models are available on which pricing tier (currently only the model list is tracked, not the per-plan availability).
- What is this tool?
- Climate TRACE estimates greenhouse gas emissions globally using satellite and sensor data.
- How much does it cost?
- Climate TRACE offers free public access to its emissions data and portal.
- Does it have a free plan?
- Yes, the platform provides free access to emissions datasets and an online portal.
- What integrations does it support?
- No public APIs or integrations are currently available.
- Who is it best for?
- It is best for policymakers, researchers, and NGOs needing detailed emissions data.
- What is this tool?
- SeeTree analyzes drone imagery to provide detailed tree health insights for commercial growers.
- How much does it cost?
- Pricing is enterprise-based and available upon request; no public pricing is listed.
- Does it have a free plan?
- No, SeeTree does not offer a free plan or public trial.
- What integrations does it support?
- No public information on integrations or API availability is provided.
- Who is it best for?
- It is best suited for commercial growers managing perennial crops who need precise tree health data.
| Info | Climate TRACE | SeeTree |
|---|---|---|
| Pricing | Freemium | Enterprise |
| Category | Agriculture & AgTech AI | Agriculture & AgTech AI |
| Deployment | Cloud | Cloud |
| Learning Curve | — | Intermediate |
| Free Plan | ✓ | ✗ |
| AI Agent | ✗ | ✗ |
SeeTree narrowly leads Climate TRACE overall (5.3 vs 5.3). The best choice depends on your specific workflow, team size, and budget.
ⓘ How Volvenix scores work
Scores are computed by Volvenix — not supplied by the vendors, and not third-party benchmark results. Each 0–10 dimension (Overall, Features, Usability, Support, Pricing) is a directional estimate aggregated from catalog signals — editorial cataloguing, content depth, engagement, and provider-reputation indicators — so treat them as a starting point, not a lab result.
Confidence reflects how complete the underlying data is for both tools; lower confidence means fewer signals were available, not a worse tool. We never accept payment for rankings or scores. More about how Volvenix works →