Kepler.gl vs CARTO
AI-enhanced independent comparison — features, pros, cons, pricing and rankings.
| Dimension | Kepler.gl | CARTO |
|---|---|---|
| Accuracy & Reliability | ||
| Ease of Use | ||
| Features & Capability | ||
| Value for Money | ||
| Performance & Speed | ||
| Popularity & Adoption |
Who each tool serves best — and when to pick the other one.
Data analysts and GIS teams needing to visualize large geospatial datasets interactively.
- You need to visualize large geospatial datasets interactively.
- You want a user-friendly interface for map creation.
- Your team requires fast exploration of location data.
Skip this tool if you require advanced analytical capabilities beyond visualization.
- You need advanced analytical tools for data analysis.
- Free-tier limits are a blocker for extensive usage.
- You require offline capabilities for map creation.
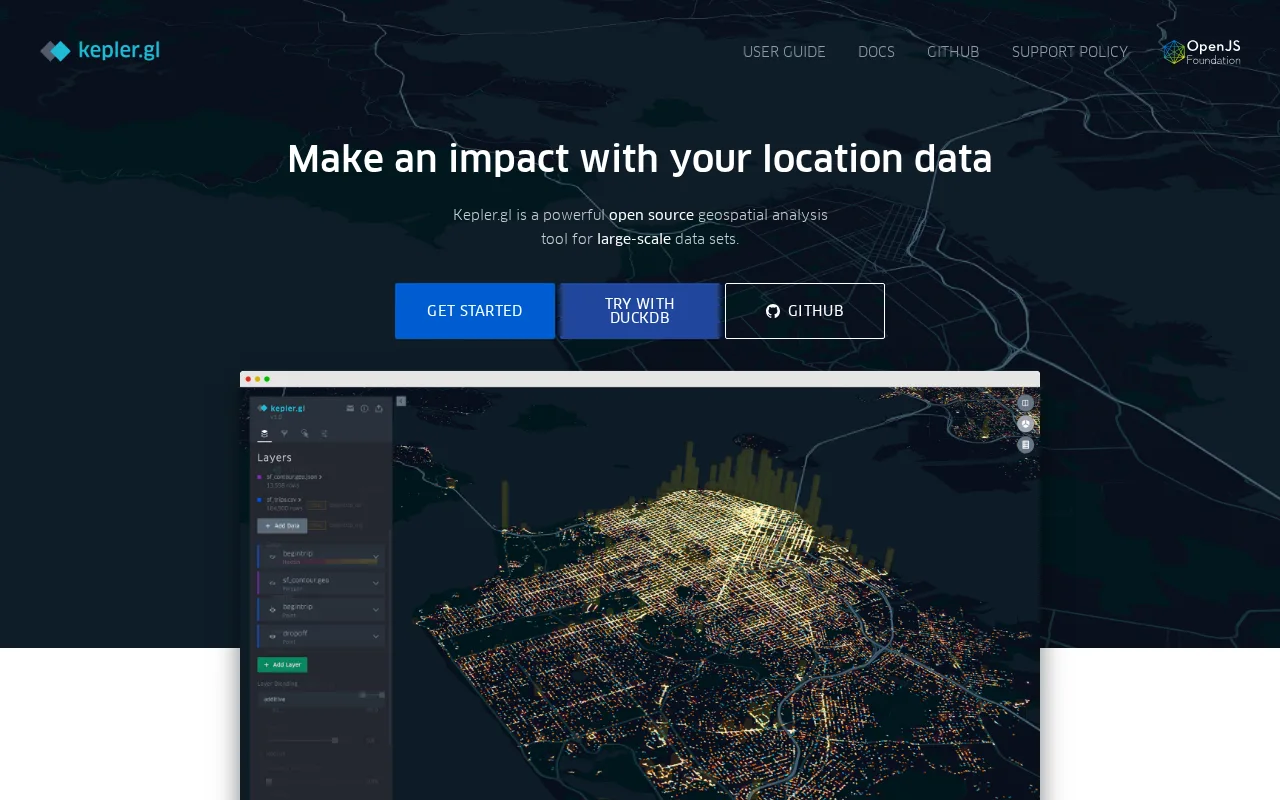
The ability to create interactive maps from extensive geospatial data.
Data scientists, GIS analysts, and developers who need scalable cloud-based geospatial visualization and analysis.
- You need to create interactive maps from complex geospatial datasets quickly and easily.
- You want to perform spatial analysis integrated with cloud data workflows and APIs.
- Your team requires scalable, shareable location intelligence tools for decision-making.
Users seeking fully free GIS software or those without any spatial data analysis needs should look elsewhere.
- You need a completely free GIS tool with no paid tiers or limitations.
- Free-tier limits are a blocker for your large-scale geospatial data projects.
- You require offline or desktop-only GIS software without cloud dependency.
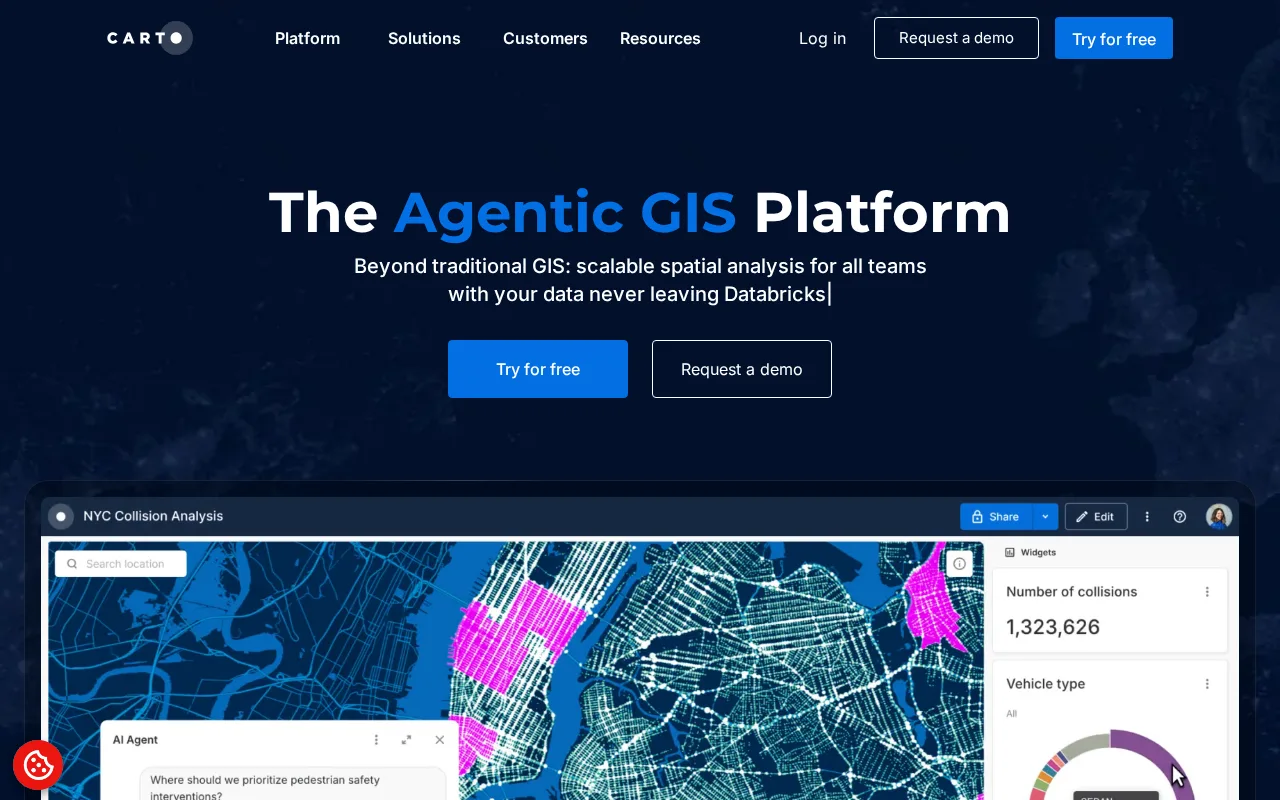
The ability to combine spatial analytics with cloud scalability and interactive mapping.
A canonical comparison across capabilities common to this category. Vendor-specific extras appear below in "Highlighted Features".
| Capability | Kepler.gl | CARTO |
|---|---|---|
|
API Access
Programmatic access via documented API
|
— | ✓ |
|
Free Tier Available
Usable without payment (with usage limits)
|
✓ | ✓ |
Each tool's marketing-listed features. Where a feature appears under one tool but not the other, it usually reflects how the vendor describes their product — not a definitive capability gap.
- Interactive Map Creation — Build maps from large datasets easily
- GPU Acceleration — Fast rendering of maps
- Data Layering — Combine multiple data layers for analysis
- Custom Styling — Style maps to fit your needs
- Export Options — Export maps in various formats
- Interactive Map Builder — Create and customize interactive maps with ease
- Spatial SQL Queries — Perform advanced spatial queries on geospatial data
- Data Integration — Connect to various data sources including cloud storage
- Advanced analytics — Access predictive and spatial analytics tools
- User-friendly interface for map creation
- Handles large datasets efficiently
- GPU-accelerated for fast performance
- Open-source and free to use
- Cloud-native platform enabling scalable geospatial analysis
- User-friendly interface for interactive map creation
- Supports integration with multiple data sources and formats
- Strong community and documentation resources
- Flexible pricing with a free tier for basic use
- Limited advanced analytical features
- No offline capabilities
- Advanced features and higher limits require paid plans
- Learning curve can be steep for users new to GIS concepts
- No official mobile app available
- Visualizing environmental data
- Mapping urban development
- Analyzing transportation routes
- Displaying demographic information
- Urban planning and infrastructure development
- Environmental monitoring and conservation
- Retail site selection and market analysis
- Logistics and supply chain optimization
- Disaster response and risk assessment
Where each tool runs — web, mobile, desktop, browser extension, API.
Natural languages each tool generates and understands. Primary languages are listed first.
What each tool can accept (input) and produce (output) — text, image, audio, video, code.
Kepler.gl is free to use, making it accessible for individuals and teams.
-
Free
Free
Offers a free tier with basic features and paid subscriptions for advanced analytics and higher usage limits.
-
Free
Free -
Pro
popular
Custom pricing -
Enterprise
Custom pricing
Regulatory frameworks each tool claims compliance with (HIPAA, SOC 2, GDPR, etc.).
None listed.
Third-party audits and certifications that verify security controls.
No certifications listed.
Vendor-published numbers each tool highlights — usage scale, breadth, and operational stats. Different tools track different metrics, so direct row-by-row comparison usually isn't meaningful.
No metrics published.
- User Base Thousands of organizations worldwide
Languages, frameworks, databases, and infrastructure each tool is built on. Mostly relevant for self-hosted or open-source tools.
Stack not disclosed.
Who each tool is positioned for — primary audience first.
How each tool is classified in the Volvenix catalog.
These vocabulary domains are managed in our catalog but not yet exposed at the tool level. We're tracking them for future expansion of this comparison.
- Encryption Types — AES-256, ChaCha20, RSA-2048, and similar at-rest/in-transit cipher families.
- Encryption Contexts — where encryption is applied (data at rest, in transit, end-to-end).
- Plan-tier Model Mapping — which AI models are available on which pricing tier (currently only the model list is tracked, not the per-plan availability).
- What is this tool?
- Kepler.gl is a web-based tool for creating interactive maps from geospatial data.
- How much does it cost?
- Kepler.gl is free to use.
- Does it have a free plan?
- Yes, it is completely free.
- What integrations does it support?
- Currently, it does not have documented integrations.
- Who is it best for?
- It is best for data analysts and GIS teams.
- What is this tool?
- CARTO is a cloud-based platform for creating interactive maps and performing spatial data analysis.
- How much does it cost?
- CARTO offers a free tier with basic features and paid subscriptions for advanced capabilities and higher usage.
- Does it have a free plan?
- Yes, CARTO provides a free plan suitable for individuals and small projects.
- What integrations does it support?
- CARTO supports integration with various data sources including cloud storage and GIS formats.
- Who is it best for?
- It is best for data scientists, GIS analysts, and developers needing scalable geospatial visualization and analysis.
| Info | Kepler.gl | CARTO |
|---|---|---|
| Pricing | Free | Freemium |
| Category | Climate & Earth Science AI | Climate & Earth Science AI |
| Deployment | Cloud | Cloud |
| Learning Curve | Intermediate | Intermediate |
| Free Plan | ✓ | ✓ |
| AI Agent | ✗ | ✗ |
Kepler.gl is a free, open-source geospatial analysis tool known for its high-performance visualization capabilities, particularly suited for large-scale data exploration. CARTO offers a freemium pricing model with additional advanced features such as spatial data enrichment and location intelligence, targeting users who need more comprehensive GIS and business analytics solutions. While Kepler.gl scored 5.7/10 overall, emphasizing ease of use and visualization speed, CARTO scored slightly lower at 5.4/10, reflecting its broader feature set but more complex pricing structure.
ⓘ How Volvenix scores work
Scores are computed by Volvenix — not supplied by the vendors, and not third-party benchmark results. Each 0–10 dimension (Overall, Features, Usability, Support, Pricing) is a directional estimate aggregated from catalog signals — editorial cataloguing, content depth, engagement, and provider-reputation indicators — so treat them as a starting point, not a lab result.
Confidence reflects how complete the underlying data is for both tools; lower confidence means fewer signals were available, not a worse tool. We never accept payment for rankings or scores. More about how Volvenix works →